If you are programming in C or C++, you should be familiar with GDB. It allows you to debug your code and easily fix bugs and issues when a program crashes. GDB is a free and powerful tool that runs on almost all operating systems, including Linux, MacOS and Windows. In this article, we will show you how to install and configure gdb on a linux machine . Also we’ll go over the fundamentals of GDB, as well as some of the useful features and options that it offers.
#1. What’s GDB
GDB, the GNU Project debugger, allows you to see what is going on `inside’ another program while it executes — or what another program was doing at the moment it crashed.
GDB can do four main kinds of things (plus other things in support of these) to help you catch bugs in the act:
- Start your program, specifying anything that might affect its behavior.
- Make your program stop on specified conditions.
- Examine what has happened, when your program has stopped.
- Change things in your program, so you can experiment with correcting the effects of one bug and go on to learn about another.
Those programs might be executing on the same machine as GDB (native), on another machine (remote), or on a simulator. [GNU]
#2. How To Check GDB On Your Machine
In order to confirm well that GDB is not already installed into our machine, we can execute this following command and see what it returns :
gdb -versionAs we can see on the output terminal that the GDB is not found and by the way not installed on our machine:
➜  ~ gdb -version
zsh: command not found: gdb
#3. How To Install GDB Into Linux
In order to install the GDB, the following command shall be used:
| Environnement | Commandes to install |
| OS X | brew install gdb |
| Debian | apt-get install gdb |
| Ubuntu | apt-get install gdb |
| Alpine | apk add gdb |
| Arch Linux | pacman -S gdb |
| Kali Linux | apt-get install gdb |
| CentOS | yum install gdb |
| Fedora | dnf install gdb |
| Raspbian | apt-get install gdb |
| Docker | docker run cmd.cat/gdb gdb |
In our case we will do installation on Debian environnement:
sudo apt-get install gdbAs we can see bellow the result of the command:
➜  ~ sudo apt-get install gdb
Reading package lists... Done
Building dependency tree... Done
Reading state information... Done
Suggested packages:
  gdb-doc
The following NEW packages will be installed:
  gdb
0 upgraded, 1 newly installed, 0 to remove and 21 not upgraded.
Need to get 3395 kB of archives.
After this operation, 10.0 MB of additional disk space will be used.
Get:1 http://deb.debian.org/debian bullseye/main amd64 gdb amd64 10.1-1.7 [3395 kB]
Fetched 3395 kB in 1s (4479 kB/s)
debconf: delaying package configuration, since apt-utils is not installed
Selecting previously unselected package gdb.
(Reading database ... 26769 files and directories currently installed.)
Preparing to unpack .../gdb_10.1-1.7_amd64.deb ...
Unpacking gdb (10.1-1.7) ...
Setting up gdb (10.1-1.7) ...
As we can see bellow the result of the command:
➜  ~ gdb -version
GNU gdb (Debian 10.1-1.7) 10.1.90.20210103-git
Copyright (C) 2021 Free Software Foundation, Inc.
License GPLv3+: GNU GPL version 3 or later <http://gnu.org/licenses/gpl.html>
This is free software: you are free to change and redistribute it.
There is NO WARRANTY, to the extent permitted by law.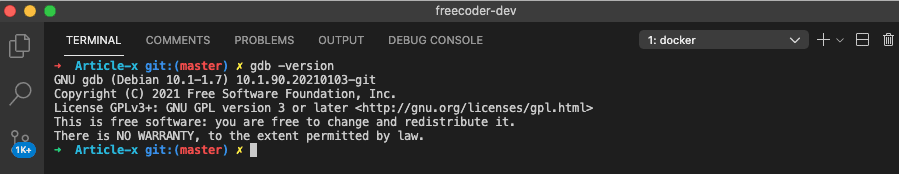
#4. GDB Fundamentals In A Case Study
In this chapter we will try to learn more about GDB, its fundamentals and some of the useful features and options it offers.
Step 1. Write a simple C program for debugging
Firstly we will take this C program as example and try to debug it using GDB:
/**
 * @file main.c
 * @author freecoder
 * @brief this program print the sum of the integers from 1 to 100
 *
 * @version 1.0
 * @date 10 oct. 2021
 *
 * @copyright Copyright (c) 2021
 *
 */

#include <stdio.h>

int main(int argc, char **argv)
{
    unsigned int uiCtr;
    unsigned int uiSum;

    uiSum = 0;

    for(uiCtr = 0; uiCtr < 100; uiCtr++)
    {
        uiSum += uiCtr;
    }

    printf("%d\n", uiSum);
    return 0;
}
Now we compile the program above and run it:
➜  ~ ll
total 4.0K
-rw-r--r-- 1 root root 453 Oct 10 14:11 main.c
➜  ~ gcc main.c -o main
➜  ~ ll
total 20K
-rwxr-xr-x 1 root root 16K Oct 10 14:14 main
-rw-r--r-- 1 root root 453 Oct 10 14:11 main.c
➜  ~ ./main
Sum=4950
Step 2. Compile the C program under debug mode
Before using gdb, we must first compile our C program with the [-g] option, which allows us to add symbols and debug information to the binary file.
➜  ~ gcc -g main.c -o main
➜  ~ ll
total 24K
-rwxr-xr-x 1 root root 18K Oct 10 16:11 main
-rw-r--r-- 1 root root 453 Oct 10 14:11 main.c
As you can see the new output file size is bigger [18K] than the first one generated a step 1 [16K] due to symbols and debug information added.
Step 3. Launch GDB and start debugging the program
To launch gdb you need just execute this command as shown below:
➜  ~ gdb main
GNU gdb (Debian 10.1-1.7) 10.1.90.20210103-git
Copyright (C) 2021 Free Software Foundation, Inc.
License GPLv3+: GNU GPL version 3 or later <http://gnu.org/licenses/gpl.html>
This is free software: you are free to change and redistribute it.
There is NO WARRANTY, to the extent permitted by law.
Type "show copying" and "show warranty" for details.
This GDB was configured as "x86_64-linux-gnu".
Type "show configuration" for configuration details.
For bug reporting instructions, please see:
<https://www.gnu.org/software/gdb/bugs/>.
Find the GDB manual and other documentation resources online at:
    <http://www.gnu.org/software/gdb/documentation/>.

For help, type "help".
Type "apropos word" to search for commands related to "word"...
Reading symbols from main...
(gdb)
Start the program debug:
(gdb) start
Temporary breakpoint 1 at 0x401135: file main.c, line 20.
Starting program: /root/main
warning: Error disabling address space randomization: Operation not permitted

Temporary breakpoint 1, main (argc=1, argv=0x7ffc82333c68) at main.c:20
20          uiSum = 0;
(gdb) list
15      int main(int argc, char **argv)
16      {
17          unsigned int uiCtr;
18          unsigned int uiSum;
19
20          uiSum = 0;
21
22          for(uiCtr = 0; uiCtr < 100; uiCtr++)
23          {
24              uiSum += uiCtr;
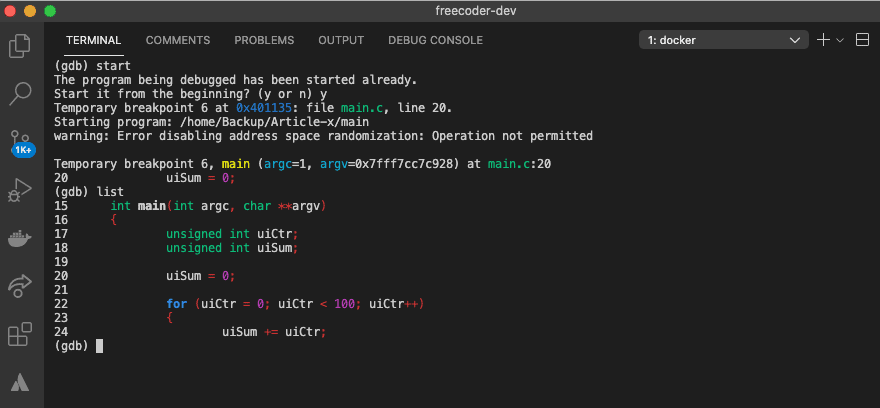
Note:
start: Start running the program and stop at a temporary breakpoint in the main function
list: Display the first 10 lines of program code.
Step 4. Setup a break point inside C program
To add a breakpoint in our C program, we use this command below:
(gdb) break 24
Breakpoint 2 at 0x401145: file main.c, line 24.
(gdb) 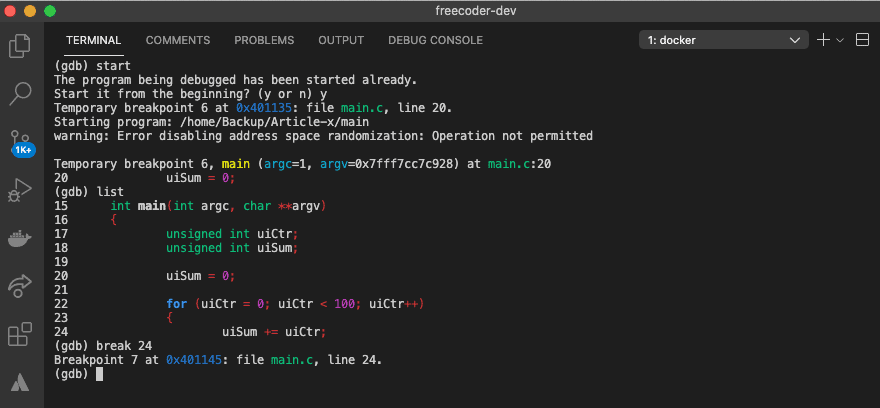
Note:
break <function/line/file:line>: Set a new breakpoint.
Step 5. Display local variables content
Run the program and inspect the content of local variables:
(gdb) run
The program being debugged has been started already.
Start it from the beginning? (y or n) y
Starting program: /home/Backup/Article-x/main
warning: Error disabling address space randomization: Operation not permitted

Breakpoint 2, main (argc=1, argv=0x7ffc14eca8c8) at main.c:24
24                      uiSum += uiCtr;
(gdb) info locals
uiCtr = 0
uiSum = 0
(gdb) info args
argc = 1
argv = 0x7ffc14eca8c8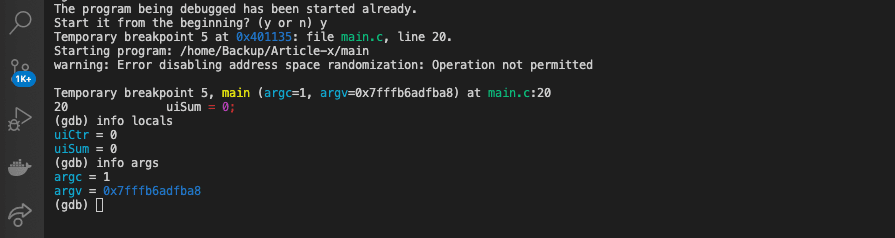
Note:
info locals: Display all local variables content.
info args: Display all arguments in use.
Also GDB allows to show variable content through the print commande:
(gdb) print uiSum
$1 = 0
(gdb) print uiCtr
$2 = 0
(gdb) print *argv@3
$8 = {0x7ffc14ecc686 "/home/Backup/Article-x/main", 0x0, 0x7ffc14ecc6a2 "HOSTNAME=ae3adb9fc0c1"}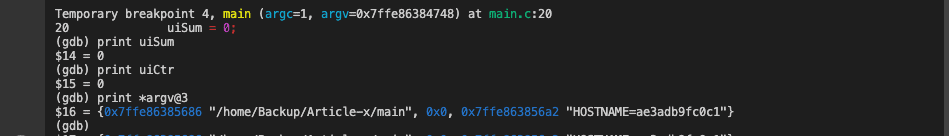
Note:
print <variable name>: Display variable content.
print *<variable name>@length: Display arrays values.
zlib: Enable the compression using zlib library.
After that we navigate step by step into the code using the STEPPING commandes:
(gdb) list
19
20              uiSum = 0;
21
22              for (uiCtr = 0; uiCtr < 100; uiCtr++)
23              {
24                      uiSum += uiCtr;
25              }
26
27              printf("%d\n", uiSum);
28              return 0;
(gdb) step
22              for (uiCtr = 0; uiCtr < 100; uiCtr++)
(gdb) s
24                      uiSum += uiCtr;
(gdb) print uiSum
$9 = 0
(gdb) s
22              for (uiCtr = 0; uiCtr < 100; uiCtr++)
(gdb) print uiSum
$10 = 1
(gdb) next
22              for (uiCtr = 0; uiCtr < 100; uiCtr++)
(gdb) print uiSum
$12 = 3
(gdb) n
24                      uiSum += uiCtr;
(gdb) n
22              for (uiCtr = 0; uiCtr < 100; uiCtr++)
(gdb) print uiSum
$13 = 6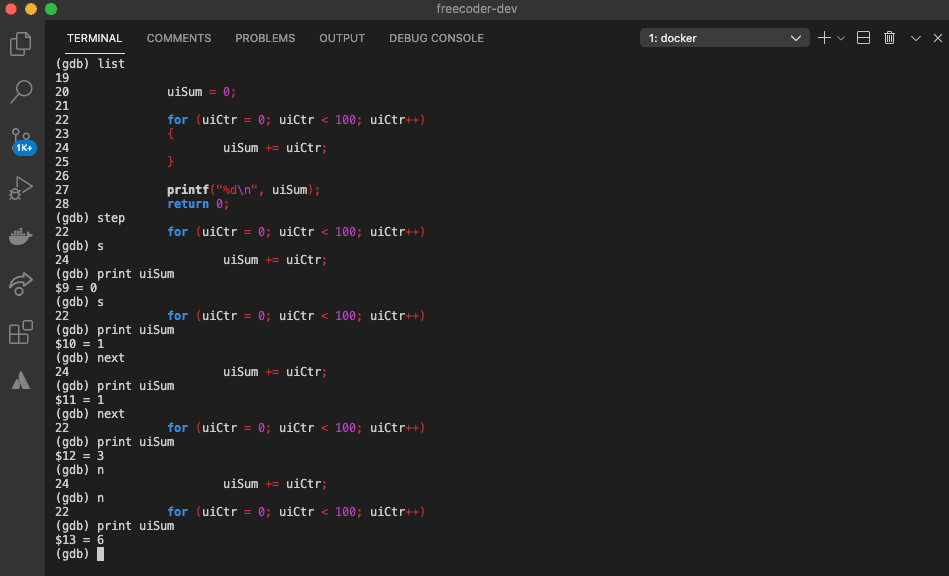
Note:
step / s <x: number of steps>: Go to the x next instructions into function line code.
next / n <x: number of steps>: Go to the x next instructions over function line code.
Step 6. Display the Assembly Code
For specific needs you can display the assembly code of your program and navigate into instruction by instruction:
(gdb) start
Temporary breakpoint 1 at 0x401135: file main.c, line 20.
Starting program: /home/Backup/Article-x/main
warning: Error disabling address space randomization: Operation not permitted

Temporary breakpoint 1, main (argc=1, argv=0x7ffda6eac178) at main.c:20
20              uiSum = 0;
(gdb) layout asm
┌─────────────────────────────────────────────────────────────────────────────────────────────────────────────────────────────┐
│   0x401126 <main>                 push   %rbp                                                                               │
│   0x401127 <main+1>               mov    %rsp,%rbp                                                                          │
│   0x40112a <main+4>               sub    $0x20,%rsp                                                                         │
│   0x40112e <main+8>               mov    %edi,-0x14(%rbp)                                                                   │
│   0x401131 <main+11>              mov    %rsi,-0x20(%rbp)                                                                   │
│   0x401135 <main+15>              movl   $0x0,-0x8(%rbp)                                                                    │
│   0x40113c <main+22>              movl   $0x0,-0x4(%rbp)                                                                    │
│   0x401143 <main+29>              jmp    0x40114f <main+41>                                                                 │
│   0x401145 <main+31>              mov    -0x4(%rbp),%eax                                                                    │
│   0x401148 <main+34>              add    %eax,-0x8(%rbp)                                                                    │
│   0x40114b <main+37>              addl   $0x1,-0x4(%rbp)                                                                    │
│   0x40114f <main+41>              cmpl   $0x63,-0x4(%rbp)                                                                   │
│  >0x401153 <main+45>              jbe    0x401145 <main+31>                                                                 │
│   0x401155 <main+47>              mov    -0x8(%rbp),%eax                                                                    │
│   0x401158 <main+50>              mov    %eax,%esi                                                                          │
│   0x40115a <main+52>              mov    $0x402004,%edi                                                                     │
│   0x40115f <main+57>              mov    $0x0,%eax                                                                          │
│   0x401164 <main+62>              call   0x401030 <printf@plt>                                                              │
│   0x401169 <main+67>              mov    $0x0,%eax                                                                          │
│   0x40116e <main+72>              leave                                                                                     │
│   0x40116f <main+73>              ret                                                                                       │
│   0x401170 <__libc_csu_init>      push   %r15                                                                               │
│   0x401172 <__libc_csu_init+2>    lea    0x2c87(%rip),%r15        # 0x403e00                                                │
│   0x401179 <__libc_csu_init+9>    push   %r14                                                                               │
│   0x40117b <__libc_csu_init+11>   mov    %rdx,%r14                                                                          │
│   0x40117e <__libc_csu_init+14>   push   %r13                                                                               │
│   0x401180 <__libc_csu_init+16>   mov    %rsi,%r13                                                                          │
│   0x401183 <__libc_csu_init+19>   push   %r12                                                                               │
│   0x401185 <__libc_csu_init+21>   mov    %edi,%r12d                                                                         │
│   0x401188 <__libc_csu_init+24>   push   %rbp                                                                               │
│   0x401189 <__libc_csu_init+25>   lea    0x2c78(%rip),%rbp        # 0x403e08                                                │
│   0x401190 <__libc_csu_init+32>   push   %rbx                                                                               │
│   0x401191 <__libc_csu_init+33>   sub    %r15,%rbp                                                                          │
│   0x401194 <__libc_csu_init+36>   sub    $0x8,%rsp                                                                          │
│   0x401198 <__libc_csu_init+40>   call   0x401000 <_init>                                                                   │
│   0x40119d <__libc_csu_init+45>   sar    $0x3,%rbp                                                                          │
│   0x4011a1 <__libc_csu_init+49>   je     0x4011be <__libc_csu_init+78>                                                      │
│   0x4011a3 <__libc_csu_init+51>   xor    %ebx,%ebx                                                                          │
│   0x4011a5 <__libc_csu_init+53>   nopl   (%rax)                                                                             │
│   0x4011a8 <__libc_csu_init+56>   mov    %r14,%rdx                                                                          │
└─────────────────────────────────────────────────────────────────────────────────────────────────────────────────────────────┘
native process 444 In: main                                                                                 L22   PC: 0x401153
(gdb) si
(gdb) stepi
(gdb) si
(gdb) si
(gdb) 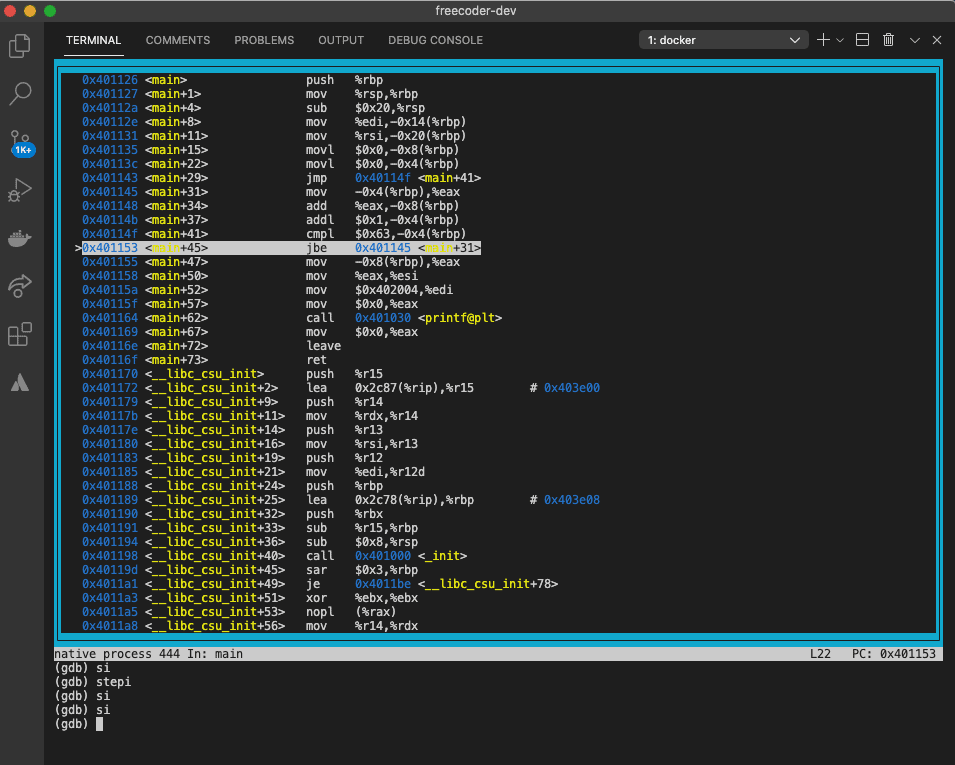
Note:
layout asm: Display the assembly code of your program.
stepi / si <x: number of steps>: Step x instructions in assembly code.
Conclusion
I Hope that this tutorial gives you some help to initiate and build your C project using the powerful docker tool.
Please don’t hesitate to share the link of this article and see you for a next post! 🙂
